
SOCIAL WELL-BEING - Social climate
The indicator Trust in institutions is based on survey responses of people regarding their trust in the parliament, government, political parties and the European Union, where the respondents answer “tend to trust”, “tend not to trust” or “don’t know”. The indicator is important for well-being, because it is linked to democratic development, which has an impact on the development of relations in a society. Growth of the indicator has a positive impact on well-being.
Figure: Trust in institutions, Slovenia, and trust in the parliament, EU, 2004–2014 (in %)
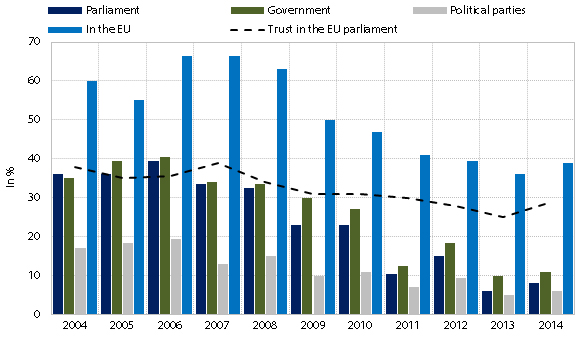
Source of data: Eurobarometer.
Note: The figure for an individual year is the average of both measurements, except for 2004 and 2010 when trust in the parliament, government and the EU was measured only once, and for 2004, 2007, 2010 and 2011 when trust in political parties was measured only once. Between 2004 and 2006 the data for the EU are for the EU-25, between 2007 and 2012 for the EU-27, and for 2013 (autumn measurement) and 2014 for the EU-28.
After the fall in 2013, people’s trust in key institutions in the country and the European Union (as the integration of Member States) slightly increased in 2014 (partly also because of elections), but remains low. To a large extent the low trust in institutions in linked with people’s dissatisfaction with the economic and political situation in Slovenia, since trust started to decline more rapidly after 2008. In all these years people trusted the EU the most and political parties in Slovenia the least. In 2014, 8% of people in Slovenia trusted the parliament, which is well below the EU average (29%). Also well below the EU average is trust in the government (11% in Slovenia, 28% in the EU) and political parties (6% in Slovenia, 16% in the EU). On the other hand, 39% of respondents in Slovenia trusted the EU, which is above the EU average (34%).
Results of supplementary indicators show:
After a large fall in 2010, in 2012 people’s trust in the legal system slightly increased; in 2014 (provisional data) it again slightly declined to the 2010 level (average assessment 3.1 on the scale from 0 to 10). In the entire period it was well below the EU average (2012: 5.2).
Compared to 2012, in 2014 (provisional data) satisfaction with democracy declined (average assessment of 2.9 on the scale from 0 to 10) and was the lowest in the last 12 years. The EU average in 2012 was 5.5.
In Slovenia voter turnout at the last parliamentary elections (in July 2014) was the lowest (51.73%) in the 1996−2014 period. At previous elections voter turnout in Slovenia was over 60%, and slightly lower than in the EU overall.
The share of women in the Slovene parliament decreased in 2013 (33%) and increased in 2014 (38%) to the 2012 level. In Slovenia the share of women in the parliament has been above the EU average (2014: 28%) since 2012.
After a jump in 2012, trust in other people slightly declined in 2014 (provisional data) to the average assessment of 4.07 on the scale from 0 to 10. However, it is still higher than in 2010, when it was the lowest in the past 12 years. People in Slovenia trust other people less than people in the EU overall, where the assessment is over 5.
According to provisional data, in 2014 contacts with relatives, friends and colleagues for social reasons decreased compared to 2012. In Slovenia, 56.7% of the population had frequent contacts in 2012, which was the most in the past 12 years; by 2014 the share declined to 53.4%. In the EU overall, over 60% of people had frequent contacts with relatives, friends and colleagues for social reasons.