
MATERIAL WELL-BEING - Income of the population
In addition to all households’ and NPISHs’ disposable cash resources, the indicator Gross adjusted disposable income of households and non-profit institutions serving households (NPISH) takes into account social transfers in kind received free of charge or at prices that are not economically relevant, such as educational, health, housing, cultural and recreational services. Gross adjusted disposable income is important for well-being because it determines the possible level of consumption of goods and public services. Its growth can be linked to a positive impact on well-being.
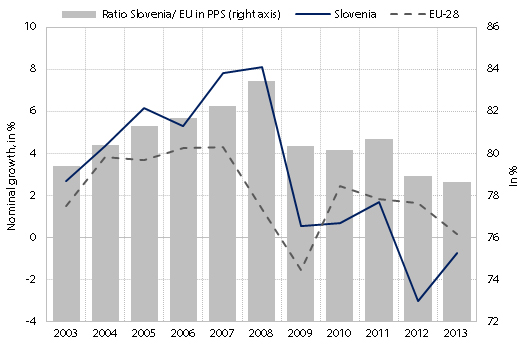
Figure: Gross adjusted disposable income of households and NPISH per capita, Slovenia and the EU, 2003−2013 (in EUR, nominal growth in %, and the ratio between Slovenia and the EU in PPS, in %)
Source of data: SURS, Eurostat.
In 2013, the gross adjusted disposable income of households and NPISH per capita in EUR continued to decline (in nominal terms by 0.7%), which was mostly linked to the deterioration of the labour market situation and the restrictive wage policy in the government sector. After rapid growth before the crisis, in the first years of the economic crisis (2009–2011) its growth slowed down significantly in response to the deterioration on the labour market. In 2012, disposable income fell for the first time, which was due to austerity measures, particularly the reduction of wages and some changes in social transfers. The nominal growth of disposable income in EUR in Slovenia was lower than in the EU, which was the result of earlier economic recovery in EU Member States than in Slovenia.
Slovenia recorded the highest level of gross adjusted disposable income per capita in PPS in 2008, which was the result of wage and employment growth in the 2004–2008 period. After 2008, when it reached 83.4% (EU=100%), gross adjusted disposable income of households and NPISH per capita in PPS started to decline and in 2013 dropped to 78.7%.
Results of supplementary indicators show:
Rapid growth of average earnings in the 2008–2011 period, which was affected by the introduction of the new public sector wage system and a considerable increase in the minimum wage, slowed down in 2012 and 2013, mostly as a result of lower public sector wages. The increase in average earnings in 2014 was a result of economic recovery as growth was also recorded in the private sector.
After a period of growth up to 2009, the average net pension started to decline in real terms. In 2014, it was around 9% lower than in 2009. In this period pension distribution did not change much.
Inequality of income distribution (measured with the income quintile share ratio 80/20) slightly increased again in 2013 (to 3.6), but in the entire period of measuring inequality (since 1997) no significant changes have been observed. In 2013, inequality was thus only 0.3 higher than before the crisis (in 2007). Differences between people with the highest and lowest income in Slovenia are among the smallest in the EU.
In 2013, the Gini coefficient, which shows income inequality, amounted to 24.4, which was 0.7 percentage points more than in 2012 and 1.2 percentage points more than in 2007. Income inequality in Slovenia has been gradually increasing since 2009, while in the EU, where it is larger (30.5), it is steady.