
MATERIAL WELL-BEING - Consumption
According to the national accounts methodology, the indicator Final consumption expenditure of households and NPISH per capita covers expenditure of resident households in Slovenia and abroad for goods and services and expenditure of non-profit institutions serving households (NPISH). Final consumption expenditure does not include purchase of real estate and valuables, which are part of investment. Households consume according to their disposable income and consumer preferences. Larger consumption has a positive impact on well-being.
Figure: Final consumption expenditure of households and NPISH per capita, Slovenia and the EU, 2000–2013 (in EUR, nominal growth in % and the ratio between Slovenia and the EU in PPS, in %)
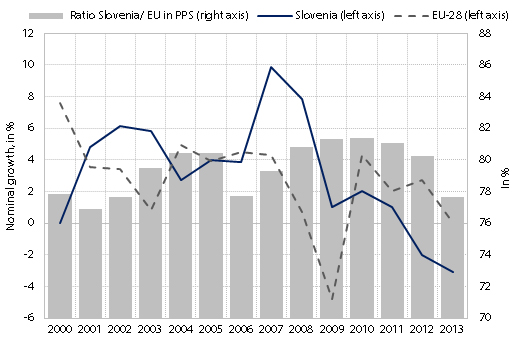
Source of data: Eurostat.
In 2013, final household consumption expenditure per capita in EUR decreased in nominal terms by 3.1% (since 2011 by 5%), which is the result of the adjustment of consumption to lower income level (deterioration on the labour market). After the fall in 2009, consumption expenditure in the EU has been gradually increasing; in 2013 it remained at the previous year’s level.
In Slovenia, final consumption expenditure of households and NPISH per capita in PPS decreased by 3.3%, widening the gap with the EU average. Slovenia lagged behind the EU average the least in 2010, when it reached 81.4% of the EU average. Significant decrease in 2013 pushed our country back to the level of 77.6% of the EU average.
Results of supplementary indicators show:
Actual individual consumption per capita in EUR continued to decline in 2013; in nominal terms it was 2.5% lower than a year earlier. Compared to 2011, when it was at the highest level, it was 5.7% lower. Actual individual consumption in PPS also declined in 2013.
Household consumption per capita (domestic concept) in EUR and in PPS declined in 2013. In EUR, consumption declined in nominal terms by 2.9%.
The economic crisis changed the structure of household consumption in Slovenia in the 2008–2013 period. Compared to 2008, in 2013 households spent a lower share of income on clothing, furniture, recreation and culture, and hotels and restaurants, and a higher share on food, non-alcoholic beverages and tobacco, housing, transport and health.