
MATERIAL WELL-BEING - Property of the population and economic security
The indicator Household financial assets per capita covers all financial assets available to households. In the structure of assets the greatest share is that of cash and deposits (around 50%), followed by stocks and other equity capital (around 30%) and insurance, pension schemes and other claims (15%). Financial assets enable consumption and saving of the population, so an increase in the volume of assets has a positive impact on well-being.
Figure: Household financial assets per capita, Slovenia and the EU, 2007–2013 (in EUR, nominal growth in %)
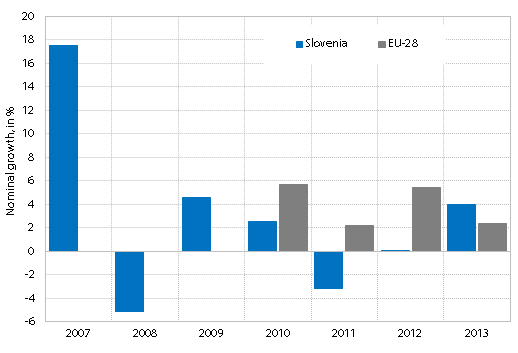
Source of data: Bank of Slovenia and Eurostat.
Note: Data for EU-28 are available only from 2010 on.
In 2013, household financial assets per capita increased in nominal terms by 3.9% and were 2.4% higher than before the crisis (2007). In 2008, financial assets in Slovenia declined similarly as in the other EU Member States due to a large drop in the amount and thus the proportion of stocks and securities in total financial assets of households. In the next few years they gradually recovered. In 2013, financial assets per capita amounted to EUR 19,204 on average, which was more than in 2007. In the EU financial assets per capita started to grow in 2009; by 2013 they grew by 16.5%.
Results of supplementary indicators show:
Despite the decline, in 2013 (31.1) household indebtedness in Slovenia, measured as a ratio of household financial liabilities to household financial assets, was higher than in 2007. In the 2008–2012 period household financial liabilities were growing faster than household financial assets, the main reason being the declining disposable income. Indebtedness measured in this way was the highest in Slovenia in 2011 and 2012 (33.2), but still lower than the EU average, which started to decline in 2012 and a year later stood at 32.7.
In 2012, the value of the housing fund owned by households grew in nominal terms by 0.8%, while in the entire 2008–2012 period it grew (7.5%) slightly less than in the EU-12* (12.3%).
Life insurance premiums amounted to 1.5% of GDP in 2013. The share was 0.1 percentage points lower than in 2012 but did not change much since 2004. The share in Slovenia is much lower than in the EU overall (4.7% in 2013).
* EU-12: Czech Republic, Denmark, Germany, Estonia, France, Cyprus, Latvia, Hungary, Austria, Slovenia, Finland and Sweden.